
 money
money Waystream Holding AB (publ) (STO:WAYS) Earns Among The Best Returns In Its Industry

Today we'll look at Waystream Holding AB (publ) (STO:WAYS) and reflect on its potential as an investment. Specifically, we'll consider its Return On Capital Employed (ROCE), since that will give us an insight into how efficiently the business can generate profits from the capital it requires.
First, we'll go over how we calculate ROCE. Next, we'll compare it to others in its industry. And finally, we'll look at how its current liabilities are impacting its ROCE.
Understanding Return On Capital Employed (ROCE)
ROCE measures the 'return' (pre-tax profit) a company generates from capital employed in its business. All else being equal, a better business will have a higher ROCE. Overall, it is a valuable metric that has its flaws. Renowned investment researcher Michael Mauboussin has suggested that a high ROCE can indicate that 'one dollar invested in the company generates value of more than one dollar'.
How Do You Calculate Return On Capital Employed?
Analysts use this formula to calculate return on capital employed:
Return on Capital Employed = Earnings Before Interest and Tax (EBIT) ÷ (Total Assets - Current Liabilities)
Or for Waystream Holding:
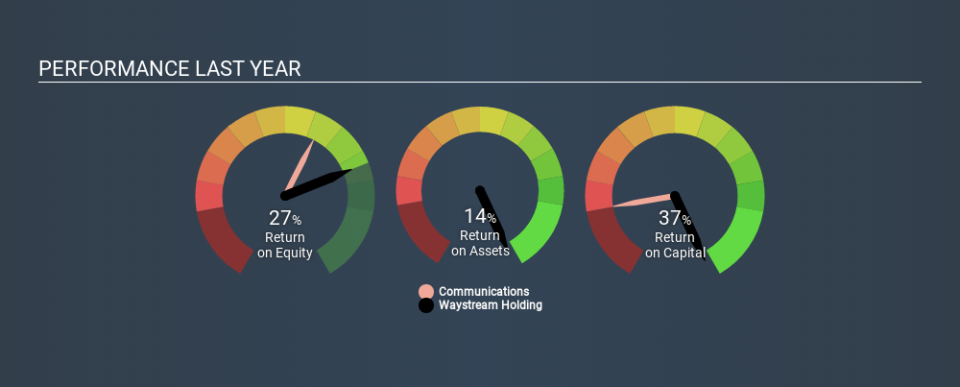
0.37 = kr9.7m ÷ (kr54m - kr27m) (Based on the trailing twelve months to December 2019.)
So, Waystream Holding has an ROCE of 37%.
Check out our latest analysis for Waystream Holding
Does Waystream Holding Have A Good ROCE?
ROCE is commonly used for comparing the performance of similar businesses. Waystream Holding's ROCE appears to be substantially greater than the 14% average in the Communications industry. I think that's good to see, since it implies the company is better than other companies at making the most of its capital. Putting aside its position relative to its industry for now, in absolute terms, Waystream Holding's ROCE is currently very good.
In our analysis, Waystream Holding's ROCE appears to be 37%, compared to 3 years ago, when its ROCE was 0.04%. This makes us think about whether the company has been reinvesting shrewdly. You can see in the image below how Waystream Holding's ROCE compares to its industry. Click to see more on past growth.
When considering ROCE, bear in mind that it reflects the past and does not necessarily predict the future. ROCE can be deceptive for cyclical businesses, as returns can look incredible in boom times, and terribly low in downturns. ROCE is only a point-in-time measure. If Waystream Holding is cyclical, it could make sense to check out this free graph of past earnings, revenue and cash flow.
What Are Current Liabilities, And How Do They Affect Waystream Holding's ROCE?
Liabilities, such as supplier bills and bank overdrafts, are referred to as current liabilities if they need to be paid within 12 months. The ROCE equation subtracts current liabilities from capital employed, so a company with a lot of current liabilities appears to have less capital employed, and a higher ROCE than otherwise. To check the impact of this, we calculate if a company has high current liabilities relative to its total assets.
Waystream Holding has total assets of kr54m and current liabilities of kr27m. Therefore its current liabilities are equivalent to approximately 51% of its total assets. Waystream Holding's high level of current liabilities boost the ROCE - but its ROCE is still impressive.
The Bottom Line On Waystream Holding's ROCE
So to us, the company is potentially worth investigating further. Waystream Holding looks strong on this analysis, but there are plenty of other companies that could be a good opportunity . Here is a free list of companies growing earnings rapidly.
If you like to buy stocks alongside management, then you might just love this free list of companies. (Hint: insiders have been buying them).
If you spot an error that warrants correction, please contact the editor at editorial-team@simplywallst.com. This article by Simply Wall St is general in nature. It does not constitute a recommendation to buy or sell any stock, and does not take account of your objectives, or your financial situation. Simply Wall St has no position in the stocks mentioned.
We aim to bring you long-term focused research analysis driven by fundamental data. Note that our analysis may not factor in the latest price-sensitive company announcements or qualitative material. Thank you for reading.
