
 money
money Reflecting on XPS Pensions Group's (LON:XPS) Share Price Returns Over The Last Three Years

For many investors, the main point of stock picking is to generate higher returns than the overall market. But the risk of stock picking is that you will likely buy under-performing companies. Unfortunately, that's been the case for longer term XPS Pensions Group plc (LON:XPS) shareholders, since the share price is down 25% in the last three years, falling well short of the market decline of around 3.9%. The silver lining is that the stock is up 3.4% in about a week.
View our latest analysis for XPS Pensions Group
While markets are a powerful pricing mechanism, share prices reflect investor sentiment, not just underlying business performance. By comparing earnings per share (EPS) and share price changes over time, we can get a feel for how investor attitudes to a company have morphed over time.
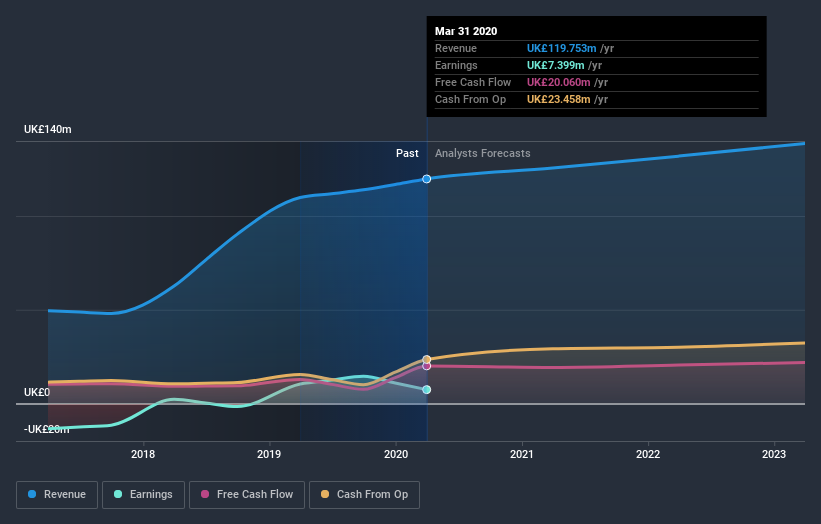
During five years of share price growth, XPS Pensions Group moved from a loss to profitability. We would usually expect to see the share price rise as a result. So it's worth looking at other metrics to try to understand the share price move.
We note that the dividend seems healthy enough, so that probably doesn't explain the share price drop. It's good to see that XPS Pensions Group has increased its revenue over the last three years. But it's not clear to us why the share price is down. It might be worth diving deeper into the fundamentals, lest an opportunity goes begging.
The image below shows how earnings and revenue have tracked over time (if you click on the image you can see greater detail).
We know that XPS Pensions Group has improved its bottom line over the last three years, but what does the future have in store? This free interactive report on XPS Pensions Group's balance sheet strength is a great place to start, if you want to investigate the stock further.
What About Dividends?
It is important to consider the total shareholder return, as well as the share price return, for any given stock. The TSR incorporates the value of any spin-offs or discounted capital raisings, along with any dividends, based on the assumption that the dividends are reinvested. It's fair to say that the TSR gives a more complete picture for stocks that pay a dividend. As it happens, XPS Pensions Group's TSR for the last 3 years was -16%, which exceeds the share price return mentioned earlier. And there's no prize for guessing that the dividend payments largely explain the divergence!
A Different Perspective
Pleasingly, XPS Pensions Group's total shareholder return last year was 10%. That includes the value of the dividend. That certainly beats the loss of about 5.1% per year over three years. We're generally cautious about putting too much weigh on shorter term data, but the recent improvement is definitely a positive. It's always interesting to track share price performance over the longer term. But to understand XPS Pensions Group better, we need to consider many other factors. Case in point: We've spotted 4 warning signs for XPS Pensions Group you should be aware of.
Of course, you might find a fantastic investment by looking elsewhere. So take a peek at this free list of companies we expect will grow earnings.
Please note, the market returns quoted in this article reflect the market weighted average returns of stocks that currently trade on GB exchanges.
This article by Simply Wall St is general in nature. It does not constitute a recommendation to buy or sell any stock, and does not take account of your objectives, or your financial situation. We aim to bring you long-term focused analysis driven by fundamental data. Note that our analysis may not factor in the latest price-sensitive company announcements or qualitative material. Simply Wall St has no position in any stocks mentioned.
Have feedback on this article? Concerned about the content? Get in touch with us directly. Alternatively, email editorial-team@simplywallst.com.
