
 money
money Gold Price Futures (GC) Technical Analysis – Potentially Bearish Secondary Lower Top May Be Forming
Gold climbed more than 1% early in the session but has since then given back all of those gains. I guess there wasn’t enough gold bug money out there willing to chase it higher at current price levels. Surprising because the chat room commentators think gold should be trading at $2000 because of all that stimulus money floating around.
The price action suggests the stimulus money is fully-priced in so unless the central banks and governments decide to throw more money into their respective economies, a gold rally is going to have trouble gaining traction. It also suggests that perhaps traders are getting fed up chasing the headlines and may be waiting for a strong pullback into a value area.
Just keep remembering that gold is an investment and not a so-called safe-haven asset. Gold investors want to buy gold low and sell it higher. Professionals are buying dollars when there is fear and they are selling gold and dollars when conditions soften.
That’s the way the market is trading now. The traditional dollar/gold relationship has been shelved for the time being.
If gold prices went up because of the threat of a major global recession then it makes sense that it should weaken a little now that the economies are opening up. But we could get another flare-up in prices if a second wave of coronavirus cases hits.
At 18:04 GMT, August Comex gold is trading $1726.70, down $0.10 or -0.01%.
In other news, the number of Americans filing for unemployment benefits held above 2 million for a 10th straight week, while a separate report showed GDP contracted at a bigger-than-expected 5% annualized rate in the first quarter, the deepest drop in output since the 2007-09 Great Recession.
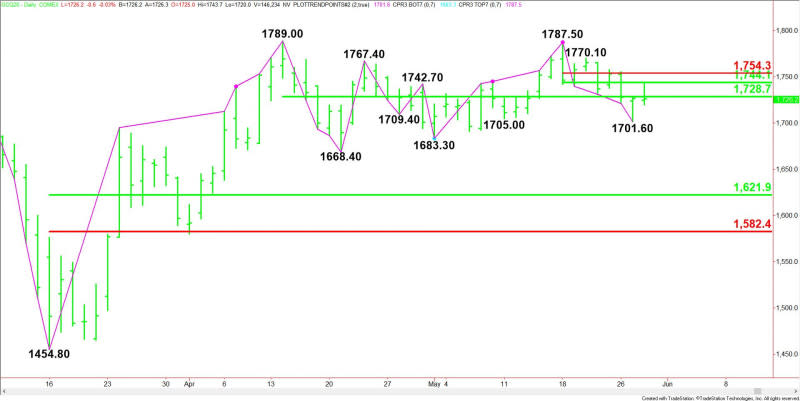
Daily Swing Chart Technical Analysis
The main trend is up according to the daily swing chart. However, momentum has been trending lower since the formation of the closing price reversal top on May 18.
A trade through $1787.50 will negate the closing price reversal top and signal a resumption of the uptrend. The main trend changes to down on a move through $1683.30, but the really hard selling is likely to start if $1668.40 fails as support.
The minor trend is down. This is controlling the momentum. Taking out $1701.60 should strengthen the downside momentum and bring the new minor top down to $1743.70.
The minor range is $1787.50 to $1701.60. Its retracement zone at $1744.10 to $1754.30 is resistance.
The short-term range is $1789.00 to $1668.40. Its 50% level at $1728.70 is potential support and also the trigger point for an even steeper sell-off.
The main range is $1454.80 to $1789.00. Its retracement zone at $1621.90 to $1582.40 is the primary downside target and potentially major support.
Short-Term Outlook
We’re going to be watching trader reaction and order flow at $1728.70 into the close. This should tell us if the selling is getting stronger or if buyers are coming in to support the market. The reaction to the earlier rally suggests the move was fueled by short-covering rather than new buying.
Furthermore, the formation of a secondary lower top at $1743.70 will be a sign of weakness.
This article was originally posted on FX Empire
