
 money
money Does The Market Have A Low Tolerance For Begbies Traynor Group plc's (LON:BEG) Mixed Fundamentals?

Begbies Traynor Group (LON:BEG) has had a rough three months with its share price down 18%. It is possible that the markets have ignored the company's differing financials and decided to lean-in to the negative sentiment. Stock prices are usually driven by a company’s financial performance over the long term, and therefore we decided to pay more attention to the company's financial performance. Particularly, we will be paying attention to Begbies Traynor Group's ROE today.
Return on equity or ROE is an important factor to be considered by a shareholder because it tells them how effectively their capital is being reinvested. Put another way, it reveals the company's success at turning shareholder investments into profits.
View our latest analysis for Begbies Traynor Group
How Is ROE Calculated?
ROE can be calculated by using the formula:
Return on Equity = Net Profit (from continuing operations) ÷ Shareholders' Equity
So, based on the above formula, the ROE for Begbies Traynor Group is:
1.4% = UK£931k ÷ UK£66m (Based on the trailing twelve months to April 2020).
The 'return' is the profit over the last twelve months. So, this means that for every £1 of its shareholder's investments, the company generates a profit of £0.01.
What Is The Relationship Between ROE And Earnings Growth?
So far, we've learned that ROE is a measure of a company's profitability. Based on how much of its profits the company chooses to reinvest or "retain", we are then able to evaluate a company's future ability to generate profits. Generally speaking, other things being equal, firms with a high return on equity and profit retention, have a higher growth rate than firms that don’t share these attributes.
Begbies Traynor Group's Earnings Growth And 1.4% ROE
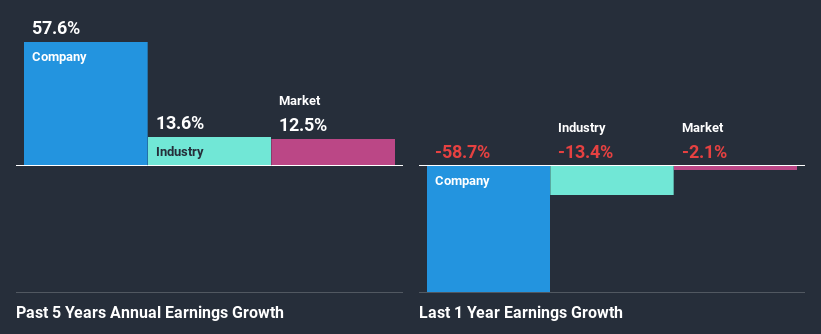
It is hard to argue that Begbies Traynor Group's ROE is much good in and of itself. Even when compared to the industry average of 15%, the ROE figure is pretty disappointing. Despite this, surprisingly, Begbies Traynor Group saw an exceptional 58% net income growth over the past five years. We reckon that there could be other factors at play here. Such as - high earnings retention or an efficient management in place.
We then compared Begbies Traynor Group's net income growth with the industry and we're pleased to see that the company's growth figure is higher when compared with the industry which has a growth rate of 14% in the same period.
Earnings growth is an important metric to consider when valuing a stock. The investor should try to establish if the expected growth or decline in earnings, whichever the case may be, is priced in. Doing so will help them establish if the stock's future looks promising or ominous. Is BEG fairly valued? This infographic on the company's intrinsic value has everything you need to know.
Is Begbies Traynor Group Efficiently Re-investing Its Profits?
Begbies Traynor Group's very high three-year median payout ratio of 201% suggests that the company is paying more to its shareholders than what it is earning. However, this hasn't hampered its ability to grow as we saw earlier. With that said, it could be worth keeping an eye on the high payout ratio as that's a huge risk. Our risks dashboard should have the 3 risks we have identified for Begbies Traynor Group.
Moreover, Begbies Traynor Group is determined to keep sharing its profits with shareholders which we infer from its long history of paying a dividend for at least ten years. Existing analyst estimates suggest that the company's future payout ratio is expected to drop to 38% over the next three years.
Conclusion
Overall, we have mixed feelings about Begbies Traynor Group. Although the company has shown a pretty impressive growth in earnings, yet the low ROE and the low rate of reinvestment makes us skeptical about the continuity of that growth, especially when or if the business comes to face any threats. On studying current analyst estimates, we found that analysts expect the company to continue its recent growth streak. Are these analysts expectations based on the broad expectations for the industry, or on the company's fundamentals? Click here to be taken to our analyst's forecasts page for the company.
This article by Simply Wall St is general in nature. It does not constitute a recommendation to buy or sell any stock, and does not take account of your objectives, or your financial situation. We aim to bring you long-term focused analysis driven by fundamental data. Note that our analysis may not factor in the latest price-sensitive company announcements or qualitative material. Simply Wall St has no position in any stocks mentioned.
Have feedback on this article? Concerned about the content? Get in touch with us directly. Alternatively, email editorial-team@simplywallst.com.
