5 years of market action in one year: Morning Brief
Friday, November 13, 2020
Get the Morning Brief sent directly to your inbox every Monday to Friday by 6:30 a.m. ET. Subscribe
Everything happens faster now. Especially in markets.
It has become a cliché during the COVID-19 pandemic to declare that “10 years of change are happening in one year.”
But clichés so often endure because in the end, they’re mostly true.
The almost overnight move to employees working from home pulled forward the expected fracturing of an increasingly digital workforce.
Forced changes to the educational system, to home buying, car buying, grocery shopping, and so on have all brought what had been almost exclusively in-person activities online.
And so any area of the economy or society that technologists had deemed behind the adoption curve pre-pandemic, that industry, consumer habit, or business demand has now been digitized.
Everything, it seems, has happened faster and more dramatically during this crisis than any previous disruption to our economy and daily lives. And so it makes sense to see the stock market essentially go through a multi-year cycle in just a few months.
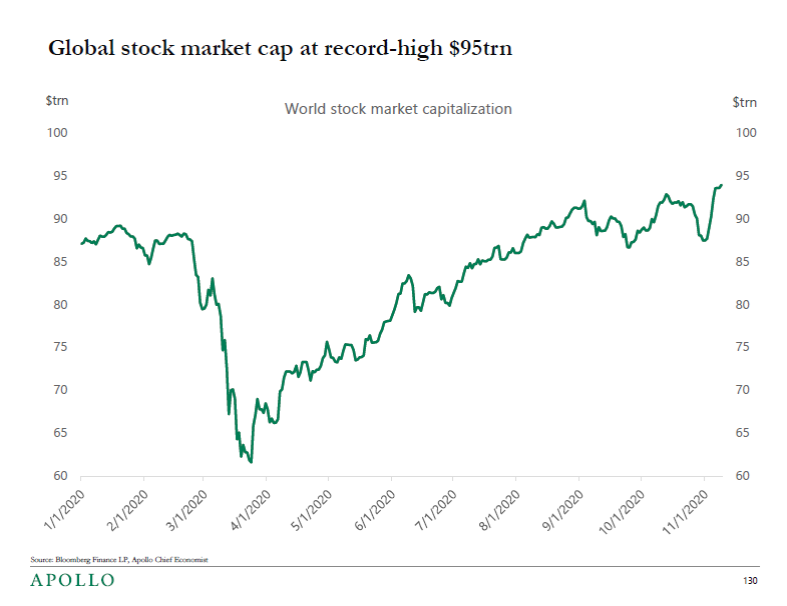
Torsten Sløk, chief economist at Apollo Global Management, sent around the following chart Thursday morning noting that the global stock market is at a record high with the total value of the world’s publicly trading equities hitting $95 trillion.

But as my Morning Brief co-author Sam Ro noted on Twitter, this chart looks almost exactly the same as the stock market from 2008-2013.
And indeed, looking at the S&P 500 from mid-2007 when the market peaked through the end of 2013 when stocks hit new highs for the first time since the crisis, the pattern is almost the same.

These similarities call to mind a favorite idea here at the Morning Brief, which says you can zoom in on any chart and make it scary or zoom out and make it look benign.
Ultimately, what is “true” in financial markets merely depends on your timescale.
But that investor behavior charted a similar course as the financial crisis — but did so in about one-fifth the time — really just sums up how this crisis is likely to be remembered by investors.
As a time when deep uncertainty hit the markets seemingly overnight.
And almost just as quickly did markets start doing what they do best — look ahead.
By Myles Udland, reporter and anchor for Yahoo Finance Live. Follow him at @MylesUdland
What to watch today
Economy
8:30 a.m. ET: PPI final demand month-over-month, October (0.2% expected, 0.4% in September)
8:30 a.m. ET: PPI excluding food and energy month-over-month, October (0.2% expected, 0.4% in September)
8:30 a.m. ET: PPI final demand year-over-year, October (0.4% expected, 0.4% in September)
8:30 a.m. ET: PPI excluding food and energy year-over-year, October (1.2% expected, 1.2% in September)
10:00 a.m. ET: University of Michigan Consumer Sentiment, November preliminary (82.0 expected, 81.9 in October)
Earnings
7:00 a.m. ET: DraftKings (DKNG) is expected to report an adjusted loss of 62 cents per share on revenue of $131.74 million
Top News
European stocks fall as COVID-19 numbers worry investors [Yahoo Finance UK]
Disney swings to a quarterly loss as pandemic pressures parks, while Disney+ subscribers top estimates [Yahoo Finance]
TikTok gets reprieve on Trump’s demand for a ban on the app [Bloomberg]
Palantir earnings beat expectations, here's what the secretive data company does [Yahoo Finance]
YAHOO FINANCE HIGHLIGHTS
Andrew Yang ‘surprised and disappointed’ that more Asian American voters didn’t renounce Trump
Unemployment hits these states the hardest as coronavirus recovery drags on
Tesla rival Xpeng is differentiating itself in the electric car market
—
Follow Yahoo Finance on Twitter, Facebook, Instagram, Flipboard, SmartNews, LinkedIn, YouTube, and reddit.
Find live stock market quotes and the latest business and finance news
For tutorials and information on investing and trading stocks, check out Cashay

 money
money 
